Time-Series Analysis of 20+ Year Treasury Bond ETF
Abstract
This paper analyzes the behavior of daily returns of the iShares 20+ Year Treasury Bond ETF (TLT), focusing on the impact of macroeconomic and financial market variables, including market volatility index, S&P500 returns, changes in Fed rates, Treasury bond market yield, and inflation. Models utilized daily data from January 2004 to July 2024, the analysis incorporates advanced time-series models to capture the dynamics of returns in TLT. An ARIMAX model with state-dependent dynamics using a Threshold Autoregressive (TAR) framework reveals the significant role of Federal Funds Rate changes in regime-dependent effects on returns. Additionally, a GARCH-ARIMAX model was employed to address volatility clustering and persistence, highlighting the impact of recent shocks and long-term volatility persistence. Both models demonstrate the critical influence of market volatility and equity returns on the daily performance of TLT. The findings provide a comprehensive understanding of the drivers of long-term Treasury bond returns and underscore the importance of accounting for regime changes and time-varying volatility in modeling.
Data
- Asset: TLT daily returns (R_TLT)
- Sample: Jan 5, 2004 – Jul 1, 2024 (5,156 trading-day observations)
- Sources: Yahoo Finance (prices/returns) + FRED (macro/market series aligned to daily frequency)
- Core drivers: VIX, S&P 500 returns (R_GSPC), inflation (INFL), 20-year Treasury yield (DGS20), changes in Fed funds rate (dFEDRATE)
- Regime definition: Monetary-policy state based on dFEDRATE (rate-cut regimes vs stable/increasing-rate regimes)
Methods
- Baseline benchmark: ARIMA(2,0,2) selected by AIC
AIC: 13,765.91
Ex-post RMSFE: 1.0598 - Preferred mean-dynamics extension (regime switching): ARIMAX(2,0,2) + TAR
Regimes defined by dFEDRATE and implemented using regime-specific lag interactions (TLT lag effects vary by policy state)
AIC: 13,148.81
Ex-post RMSFE: 0.9097872 - Volatility modeling (best overall in the writeup): GARCH(1,2) variance layered on an ARIMA(1,0,3)
Captures volatility clustering and persistent variance dynamics
ARCH effects: ARCH LM χ² = 725.141 (p = 0.0000)
AIC: 12,191.62
Ex-post RMSFE: 0.90935889
Key Results
What the models agree on:
- Flight-to-safety is the dominant daily mechanism. Across specifications, VIX is positively associated with TLT returns and S&P 500 returns are negatively associated, consistent with risk-off periods supporting long-duration Treasuries.
- Monetary policy regimes materially change return dynamics. The ARIMAX+TAR results show that the impact of lagged TLT returns differs between rate-cut and stable/increasing-rate regimes (dFEDRATE-based state interactions).
- Volatility clustering is large and persistent. Strong ARCH effects and GARCH dynamics indicate that volatility shocks propagate forward, making constant-variance models inadequate for this series.
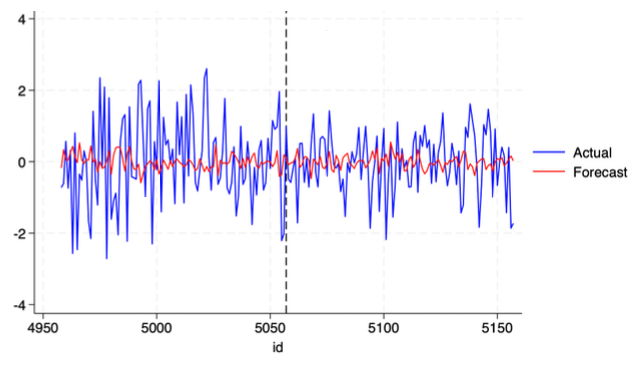
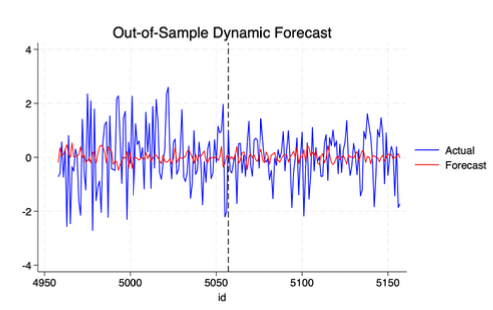
- Regime + volatility structure improves forecast performance vs baseline. Relative to the ARIMA benchmark (RMSFE 1.0598), both the TAR and GARCH specifications reduce forecast error to approximately 0.91, with the GARCH-ARIMAX model also delivering the strongest overall fit (lowest AIC).
Conclusion
Across 2004–2024, TLT's daily returns are best explained by risk-off conditions (higher VIX and weaker equities) and monetary-policy regime shifts captured by changes in the Fed funds rate. Incorporating regime dependence and time-varying volatility improves fit and reduces forecast error relative to a baseline ARIMA model, and the GARCH-ARIMAX specification provides the most realistic description of volatility behavior in TLT returns.
Key Model Outputs
GARCH(1,2) with ARIMAX(1,0,3) Model Results
| Variable | Coefficient | Std. Error | t-value | p-value | Sig |
|---|---|---|---|---|---|
| X-Var (Explanatory Variables) | |||||
| VIX (CBOE Volatility Index) | 0.030 | 0.009 | 3.24 | 0.001 | *** |
| VIX L (VIX Lag 1) | -0.029 | 0.009 | -3.15 | 0.002 | *** |
| R_GSPC (S&P 500 Returns) | -0.223 | 0.015 | -14.92 | 0.000 | *** |
| R_GSPC L (S&P 500 Returns Lag 1) | 0.011 | 0.009 | 1.29 | 0.198 | |
| INFL (Inflation) | -0.017 | 0.006 | -2.68 | 0.007 | *** |
| DGS20 (20-Year Treasury Constant Maturity Rate) | 0.017 | 0.006 | 2.76 | 0.006 | *** |
| dFEDRATE (Change in Federal Funds Rate) | -0.690 | 0.327 | -2.11 | 0.035 | ** |
| AR (Autoregressive) | |||||
| L (AR Lag 1) | -0.904 | 0.077 | -11.69 | 0.000 | *** |
| MA (Moving Average) | |||||
| L (MA Lag 1) | 0.886 | 0.078 | 11.36 | 0.000 | *** |
| L2 (MA Lag 2) | -0.048 | 0.019 | -2.49 | 0.013 | ** |
| L3 (MA Lag 3) | -0.044 | 0.014 | -3.04 | 0.002 | *** |
| ARCH (Autoregressive Conditional Heteroskedasticity) | |||||
| L (ARCH Lag 1) | 0.079 | 0.007 | 10.93 | 0.000 | *** |
| GARCH (Generalized Autoregressive Conditional Heteroskedasticity) | |||||
| L (GARCH Lag 1) | 0.389 | 0.102 | 3.80 | 0.000 | *** |
| L2 (GARCH Lag 2) | 0.521 | 0.098 | 5.29 | 0.000 | *** |
| Constant | |||||
| Constant | 0.009 | 0.002 | 5.10 | 0.000 | *** |
*** p<0.01, ** p<0.05, * p<0.1. Number of obs: 5155. Mean dependent var: 0.018. SD dependent var: 0.921. Chi-square: 1220.283 (Prob > chi2: 0.000). Akaike crit. (AIC): 12191.621.
ARIMAX(2,0,2) with TAR Model Results
| Variable | Coefficient | Std. Error | t-value | p-value | Sig |
|---|---|---|---|---|---|
| TAR (Threshold Autoregressive) | |||||
| state_neg (Rate Cut Regime Intercept) | 0.023 | 0.036 | 0.63 | 0.527 | |
| state_neg_TLT (Rate Cut Regime: TLT Lag 1) | 0.073 | 0.012 | 5.86 | 0.000 | *** |
| state_neg_TLT2 (Rate Cut Regime: TLT Lag 2) | -0.082 | 0.012 | -7.01 | 0.000 | *** |
| state_pos_same (Stable/Increasing Rate Regime Intercept) | 0.037 | 0.031 | 1.21 | 0.228 | |
| state_pos_same_T (Stable/Increasing Rate Regime: TLT Lag 1) | -0.047 | 0.014 | -3.30 | 0.001 | *** |
| state_pos_same_TLT2 (Stable/Increasing Rate Regime: TLT Lag 2) | -0.030 | 0.015 | -2.00 | 0.045 | ** |
| X-Var (Explanatory Variables) | |||||
| VIX (CBOE Volatility Index) | 0.026 | 0.007 | 3.86 | 0.000 | *** |
| VIX L (VIX Lag 1) | -0.024 | 0.006 | -3.73 | 0.000 | *** |
| R_GSPC (S&P 500 Returns) | -0.221 | 0.010 | -21.90 | 0.000 | *** |
| R_GSPC L (S&P 500 Returns Lag 1) | 0.031 | 0.008 | 4.10 | 0.000 | *** |
| INFL (Inflation) | -0.014 | 0.005 | -2.80 | 0.005 | *** |
| AR (Autoregressive) | |||||
| L (AR Lag 1) | 1.933 | 0.006 | 299.61 | 0.000 | *** |
| L2 (AR Lag 2) | -0.984 | 0.007 | -151.14 | 0.000 | *** |
| MA (Moving Average) | |||||
| L (MA Lag 1) | -1.941 | 0.005 | -415.11 | 0.000 | *** |
| L2 (MA Lag 2) | 0.992 | 0.005 | 211.05 | 0.000 | *** |
| Constant | |||||
| Constant | 0.864 | 0.006 | 144.91 | 0.000 | *** |
*** p<0.01, ** p<0.05, * p<0.1. Number of obs: 5155. Mean dependent var: 0.018. SD dependent var: 0.921. Chi-square: 1268245.504 (Prob > chi2: 0.000). Akaike crit. (AIC): 13148.809.